(Aug 1st, 2025)
Pali Builds reviews all sales of homes or lots sold in the Pacific Palisades. After thoroughly reviewing sales records,including buyer information, we will post the numbers here. All numbers are from the time of the Palisades fire, January 7th, 2025 to the most recent month.
Total lots sold:
160
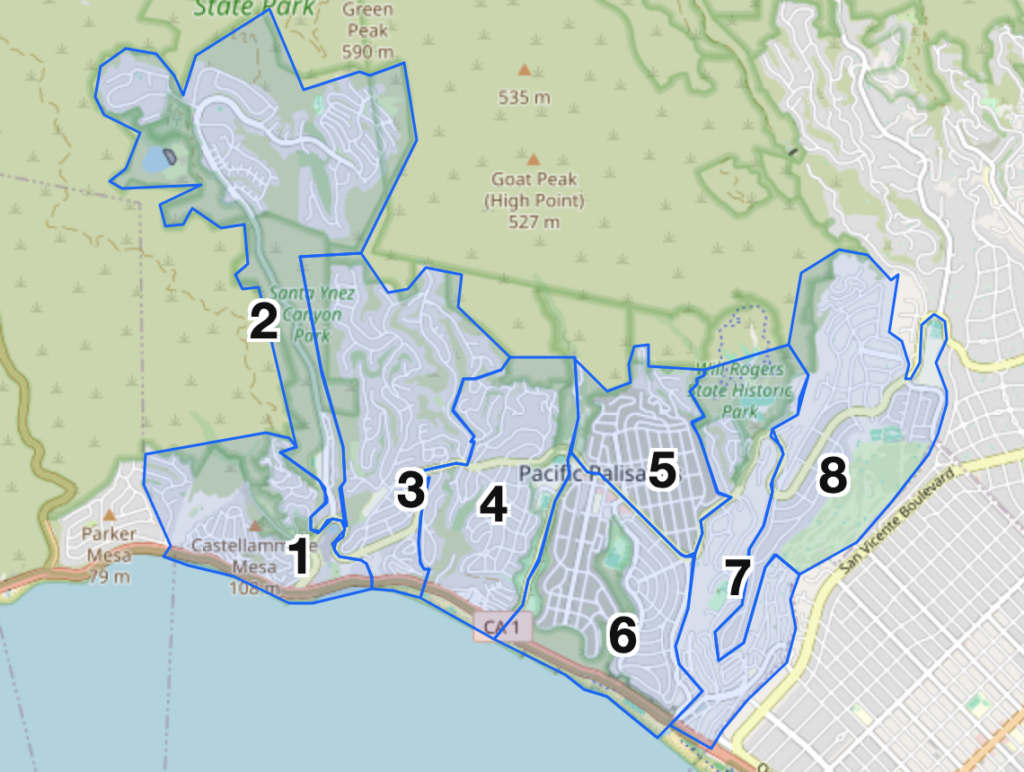
Homes Sold By Area
| Area # | Total Sales | Average Price | Median Price | Total Volume |
|---|---|---|---|---|
| Area 1 | 7 | $2,057,857 | $2,250,000 | $14,405,000 |
| Area 2 | 16 | $1,701,402 | $1,489,500 | $27,222,435 |
| Area 3 | 25 | $2,192,480 | $1,730,000 | $54,812,000 |
| Area 4 | 15 | $1,810,000 | $1,600,000 | $27,150,000 |
| Area 5 | 48 | $2,108,620 | $1,822,500 | $101,213,750 |
| Area 6 | 34 | $3,161,618 | $3,312,500 | $107,495,000 |
| Area 7 | 4 | $7,241,125 | $7,337,000 | $28,964,500 |
| Area 8 | 11 | $10,586,318 | $10,225,000 | $116,449,500 |
| Total | 160 | $477,712,185 |
Buyer Type
| Buyer Type | Jan thru July |
|---|---|
| Individual | 85 |
| Entity | 64 |
| Unknown | 11 |